When metrics mislead: BMI

Lambert Quetelet was a Belgian astronomer, mathematician, statistician, and sociologist born in Ghent in 1796. His work transcended the boundaries of science and statistics, influencing the fields of public health, social science, and anthropology.

Quetelet’s journey toward developing what we now know as the Body Mass Index (BMI) was rooted in his broader quest to understand human characteristics and society through the lens of statistical averages.

Quetelet aimed to quantify the “average man” in terms of physical and social attributes, believing that this would help identify the underlying structures of society. His work laid the groundwork for the modern field of statistics and its application in public health and social sciences.

BMI is a thorny concept. One the one hand the measure is easy to understand and useful. It allows you to make population level comparisons quickly.

On the other hand: it is often misleading at the individual level. Any elite rugby player would be classed as obese.

Also, whilst it’s not a complex calculation, getting people to divide their weight (kg) by the square of their height (in metres) leaves plenty of room for error.

The main issue however is the absolute nature of BMI. If you are in the 18.5 to 24.9 range you are classed as being healthy. Someone who steps on the scales before lunch with a BMI is 24.9 is happy, and 10 minutes later after eating a boiled egg washed down with a glass of water suddenly reaches a BMI of 25 and is not.

Our world is nuanced, but BMI is not. All metrics lack context: they make us doubt ourselves, when really we should be looking at the issue in the round, with a healthy dose of perspective

When does a measure stop being a good measure?

New thinking on BMI comes from Dr Julian Hamilton-Shield. He suggests the waist-to-height ratio (waist in cm divided by height in cm) is a better indication of adiposity. Using this measure, weight should be less than half height (0.5).  

No perfect measures

Yet, even Hamilton-Shield admits that the optimum way of measuring adiposity is to use an fMRI scanner to measure fat vs. mass bone mass in each person individually. This is obviously impractical!

But we need the best surrogate measure we can get. What’s easy gets used. What’s easy spurs action. Yet despite weight/height being about as simple as you can get – it still requires scales and a tape measure. This is where theory comes crashing into practice: 2 in 5 UK households don’t have a set of weighing scales. The public health challenge continues. 

So to summarise, whatever the domain – whether you are interested in weight, customer satisfaction or a company’s valuation:

  • No perfect measure exists
  • Every measure has inherent dependencies and challenges
  • Metrics are there to guide our judgment not to replace it
  • We should think of metrics as mere indicators – the first step in a journey of understanding

Posted in Behavioural Science, Market Research | Tagged , , , | Leave a comment

The information trap: how excess information can compromise decision quality

Another week, another episode of Location Location Location.

We meet Emma, a conscientious first time buyer whose journey into the housing market becomes an epic saga. Armed with her spreadsheet and an unwavering spirit, Emma embarks on her quest for the perfect home. She pores over every detail, from mortgage rates to crime stats to the number of paces to the nearest tube stop. As the piles of data grow, she narrows her choices with the help of a colour-coded 17-point checklist. She’s adamant she knows what she wants… but hasn’t viewed a property in 3 months. Enter Kirsty and Phil stage left to rescue the situation in a comforting three-act narrative.

It raises the question at what point does too much information make a decision harder?

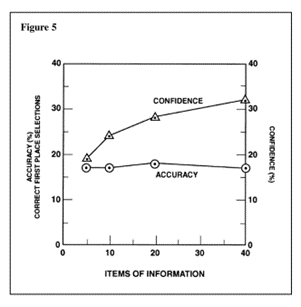
To answer this, let us turn our attention to a fascinating experiment by Paul Slovic, a distinguished psychologist based at the Oregon Research Institute. Slovic investigated professional horse bettors. Slavic found that beyond a certain threshold (5 pieces of information), additional information stopped adding to the bettor’s decision accuracy. New information didn’t improve the decision – it only served to make them more confident about the decision they had already made (see figure below).

The lesson? Don’t go hunting for new data forever. Beyond a certain threshold more information can bog you down. In fact it can put you on a path to overconfidence and confirmation bias.  

Why is this? When the volume of information increases, our ability to separate signal from noise becomes compromised. We lose sight of what’s really important. This is a paradox: a “less-is-more” effect.

I first came across the study in the Central Intelligence Agency’s book “The Psychology of Intelligence Analysis“. CIA trainers use the case study to help new analysts make the right calls because it exemplifies the stresses caused by information overload.

How do we know what is “the signal”, and what is “the noise”?

If you’re reading this, you’re probably required to plough through lots of information on a daily basis. The study poses some interesting questions about human judgment.

The irascible philosopher Nassim Taleb distinguishes between “the signal”, which represents valid predictive information, and “the noise”, which encompasses extraneous or random data.

To recap on our horse racing example, the experts who had 20 years of experience handicapping horse races have deep expertise: they know which variables matter. Their hard-won experience has developed their intuition: an ability to acquire knowledge without recourse to conscious reasoning. An unconscious pattern-recognition guides them to what matters.  

“Come on Emma… The outside space or the second bedroom – pick one!”

Novices can fall into the trap of building abstractions upwards from data – leading to erroneous conclusions. We’ve all been flummoxed by decisions, like our friend Emma – needing the perspective of a seasoned advisor to reduce, simplify and clarify.  

When is the right time to stop thinking and start acting?

Decisions are always a matter of weighing probabilities.

Client teams launching new products should need to accept they operate in complex, ambiguous marketplaces. Aiming to make the best decision for the situation they face today is sufficient if they are primed to pivot tomorrow.

Because let’s face it, how many decisions are truly one-way doors? In more and more domains you can tweak your service or proposition on the fly. We saw this first hand recently on a product launch. Our client gave us a great schooling in agile innovation, gathering enough data to soft launch for one audience, then expand the offering in a live environment.

A rule of thumb

Former US Secretary of State Colin Powell developed a useful rule of thumb here: the 40-70 rule. His view? You need between 40 and 70 per cent of the total information to make a decision. Too little information and you’ll make a poor choice – but if you seek complete information it will end up taking too long. Decisions end up being made for you.

In summary: despite uncertainty, we must act.

Posted in Behavioral Science, Behavioural Science, Choice, Consumer Psychology, Decision Science, Market Research | Tagged , , , , , , , , | Leave a comment

Deceptive patterns: exposing the tricks tech companies use to control you

The Venus Flytrap is nature’s cunning strategist. This unique plant, with its jaw-like leaves and sensitive trigger hairs, is an epitome of evolutionary ingenuity. It lures, captures, and digests unsuspecting insects employing a remarkable blend of allure and deception.

This remarkable strategy mirrors how some companies use attractive facades to draw consumers into traps as unsuspecting as the fly in the grasp of the flytrap’s leafy jaws.

Harry Brignull coined the term “dark patterns” back in 2010 defining it as a ‘user interface that has been carefully crafted to trick users into doing things, such as buying insurance with their purchase or signing up for recurring bills’. He has spent his time since becoming an expert in the topic, documenting examples on his website, speaking at conferences and giving evidence both to Government reviews and in legal cases as an expert witness. Think of him as the Martin Lewis of digital design, seeking out those who use behavioural science for nefarious ends.

Deceptive Patterns was published late in 2023. It is the definitive book on the topic, drawing together evidence from across the world. Brignull carefully categorizes, explains and elucidates the different flavours of deceptive pattern – using copious real-world examples. The topic is interesting both because it sits at the intersection of applied psychology, design and law, and because it is highly dynamic. Consumers learn by trial and error, companies evolve their tactics and legislation grinds slowly forwards.

A useful taxonomy

Brignull relies on the Mathur et al 2019 taxonomy in his work as an expert witness. It categorises deceptive patterns into sneaking (e.g. hidden costs), urgency, misdirection, social proof, scarcity, obstruction (e.g. hard to cancel), and forced action (e.g. having to share your info to complete your task).

Pressure selling

Whilst all categories are important, two animate me most.

Anyone who has booked an airline ticket or hotel online will be familiar with messages relating scarcity (“2 rooms left!”) and social proof (“5 people looking at this room now”). They are so frequently used as to be comical to the regular user.

I have lost count how many consumers have mentioned it to me in interviews. I completed an online experiment to explore the issues back in 2019 which was published in Behavioural Scientist. The verdict? Two thirds of the British public (65 percent) interpreted examples of scarcity and social proof claims used by hotel booking websites as sales pressure. Half said they were likely to distrust the company because of seeing them (49 percent).  

The working assumption for the average person in our study was that companies were falsely claiming scarcity and social proof as a sales ploy. Evidence from the book confirms this suspicion. There are a boatload of Shopify countdown timer online shop extensions: sellers can just create a countdown timer for their sale to end… which then resets itself as soon as the time elapses. Similarly Hey!Scarcity Low Stock Counter provides helpful drop down menus to create fictitious low stock messages. Their sales copy bluntly states business can use the tool to “hurrify visitors and create a sense of urgency & scarcity.” As the Competition and Markets Authority has found, the effects of these deceptive patterns are combinatorial, the net result being that people feel pressured and uncomfortable. That’s not nice!

Pic: “Hey!Scarcity’s” Low Stock Counter app

Why is this important?

Firstly, because it is widespread. The biggest companies in the world which you rely on daily – like Google, Apple, Facebook and Amazon – are all guilty of employing these tactics historically.

But second, and most importantly, when a company opts to use a deceptive pattern then exploit human vulnerabilities. We all get busy, tired & distracted from time to time so it is hard for the consumer to keep their guard up permanently. But if you consider that the most vulnerable in society may be time-poor, have lower educational attainment and rely on a smaller screen with lots of scrolling – it becomes urgent. Indeed, recent research has shown how deceptive patterns are being used to push people of limited means towards expensive credit like Buy Now Pay Later. It just should not happen.

Pic: Citizen’s Advice “Buy Now…. Pain Later?” report – showing people are often defaulted into BNPL credit

The future

The EU is being proactive with legislation and investigation. GDPR covers some of the relevant territory and 2024 sees the Digital Services Act and the Digital Markets Acts come into force. In the UK the Competition and Markets Authority is on the case, with a particular focus on Choice Architecture and Hotel Booking.

Education, legislation & enforcement, and industry self-regulation are all needed to make things better for consumers. Otherwise, like unsuspecting insects they will be snapped up in the all-powerful jaws of Dionaea muscipula.

Posted in Behavioral Science, Behavioural Science, Books, Consumer Psychology, Market Research, Technology | Tagged , , , , , | Leave a comment

The Lollapalooza effect: decision-making in the real world

Famed investor Charlie Munger died last In November just a couple of months shy of his hundredth birthday. Vice chairman of megacorp Berkshire Hathaway, he had a long track record of success. His long-term perspective and investment acumen meant he cashed out with assets of over $2 billion.

Munger wasn’t just an investor. He was a student of the human condition, devoting much of his time to considering how and why people do what they do. He was also fearless, eschewing the comfort of dogma and reasoning upwards from first principles. This is harder than it first seems. He spent much of his day reading, combining disciplines like psychology, economics, and history to form his own framework to making better decisions.  

Why would a money man have such a relentless focus on decision-making? Well, as anyone who has tried to invest their own money will tell you, investing decisions are hard. Many clever people have been humbled in the attempt to beat the market, falling prey to overconfidence (“I have a medical degree, I think I can pick a few companies to invest in!”), social proof (“I keep hearing about Tesla going up and up from my mates, it might be worth a few quid”) to anchoring (“It was at £120 a share last year so £80 is a bargain”).

And whilst there is an entire field of study (behavioural finance) devoted to the frailties of human financial decision making, Munger’s multidisciplinary approach and relentless curiosity meant he was able to connect the dots in a way that academics cannot and will not do.

A crude analogy: academia is about mapping the rules of the game, business is about winning the game.

An academic is incentivised to add yet another (oh so similar) cognitive bias to the landfill of social psychology research. Academics are measured on their citation& publication count – not holistic cross-disciplinary explanations of human behaviour.

By comparison investors are incentivised to make the right decision to return a profit over an appropriate timeframe. Their measure of success is whether their investment is worth more after a month, year or decade. There is no room to hide.

The Lollapalooza effect  

The Lollapalooza effect is an example of the theoretical versus the applied. Munger coined the term to refer to a situation where multiple biases, tendencies, or mental models act in concert to produce an extreme outcome. Typically, cognitive biases are studied in isolation in order to separate cause and effect, and unpick the drivers of decision making. But individual biases fail to capture the complexity of real world decision-making as people are influenced by a range of influences simultaneously. Different biases can work together, amplifying each other’s impact.

Here’s Munger describing his thinking at the 2017 Daily Journal Annual Meeting:

“Well, I coined that term the “Lollapalooza effect” because when I realized I didn’t know any psychology and that was a mistake on my part, I bought the three main text books for introductory psychology and I read through them.  And of course being Charlie Munger, I decided that the psychologists were doing it all wrong and I could do it better.  And one of the ideas that I came up with which wasn’t in any of the books was that the Lollapalooza effects came when 3 or 4 of the tendencies were operating at once in the same situation.  I could see that it wasn’t linear, you’ve got Lollapalooza effects. But the psychology people couldn’t do experiments that were 4 or 5 things happening at once because it got too complicated for them and they couldn’t publish.  So they were ignoring the most important thing…”                                                                                                                            

When you look at social phenomena you see Lollapalooza effects everywhere. A good example is stock market bubbles. When confirmation bias (the tendency to search for, interpret, favour, and recall information in a way that confirms one’s preexisting beliefs) intersects with social proof (the reliance on others’ actions to guide behaviour) and optimism bias (the market keeps rising) the result can be a significantly distorted decision-making process. Unsustainable valuations are the result.

Auctions are another good example: we’ve all seen prices going much higher than they would be in a non-competitive setting. Here we have the social proof of observing others bidding combining with the scarcity whipped up by an auctioneer, on top of a commitment to follow through on your initial bid.  

Implications for researchers

First an epistemological one. Often the greatest insights come in the gaps between disciplines. The cross-pollination of ideas is always powerful.

Second, and more practically, stepping back and thinking clearly about cause and effect. We should see the system. The world is full of people reducing problems to simple, linear solutions. As Rory Sutherland put it:

Organisations often make solutions based on a model of reality, rather than the complexity of lived experience… It is easier to reduce everything into a two body problem which you can solve with a simplistic model..”

Unfortunately this leads to false precision and solutions too brittle to bloom in the wild. Complex adaptive systems involve feedback loops, many of which we are unaware of or are too difficult to model.

Third? We can all be a little more humble. The world is complex. Human behaviour is so driven by context that it is frustratingly hard to predict. That’s OK! Just keep an open mind.

In the words of Munger “It’s good to learn from your mistakes. It’s better to learn from other people’s…”

Posted in Behavioral Science, Consumer Psychology, Decision Science, Finance | Tagged , , , , , , , | Leave a comment

Remove friction to supercharge sales

Friction in a customer journey can make or break a business. It’s the unnecessary hassle, confusion, or delay that a customer encounters when trying to interact with your products or services. In this blog post, we’ll break down the concept of friction and show you how to identify and reduce it for a smoother and more satisfying customer journey.  

The Crocs checkout debacle

Have you ever had one of those days where technology seems to conspire against you? I recently had one such adventure while trying to buy a pair of Crocs from their website. What should have been a straightforward online shopping experience turned into a trilogy of checkout failures.

After selecting my desired pair of cozy Crocs my shopping cart was bursting with rubbery potential. I proceeded to checkout and filled in my card details and clicked submit. But wait! Instead of a confirmation message I was redirected to their homepage. Did my order vanish into the ether? It was a true mystery of the digital age.

Whilst I had no confirmation email, I was wary about repeating the order in case it had gone through. Suppressing the image of said Crocs dancing a price-raising conga in my browser I waited a week then tried again.

And the same thing happened. Twice. The website stared back at me, as if to say, “Your Crocs are here, but you can’t have them!” In the end, I had to admit defeat and bought a similar pair on Vinted.

The lesson here? Friction costs you money.In the physical world friction stops motion. In the world of e-commerce it means abandoned sales.

Unpacking Vinted’s Success

Vinted is Europe’s top app for buying and selling used clothes. It has a €3.5bn valuation and it is growing fast.

Its success provides a fascinating case study in the art of reducing friction for customers.

Here’s how they do it…

It’s easy to sell

It’s free to list your item. This removes the main barrier all resale apps face – getting people to list their clothes for sale in the first place. Making listings free has turbocharged Vinted’s growth.

The listing process itself is simple: snap your item, then pick from drop down menus to categorise it.

Deciding what price to sell at is helped by automated pricing: the platform uses photo recognition tech to suggest a reasonable price based on what similar items have sold for. This is a game-changer for those new to online selling, as it eliminates a significant decision-making hurdle.

Vinted removes another common obstacle in the resale process by providing straightforward shipping solutions. Buyers select from predefined options and prepay for shipping through the platform. This eliminates the need for sellers to navigate the complexities of postage and shipping costs, making it hassle-free.  

What’s more, sellers don’t have to print a label: you pack up your item, download a barcode then take it to your nearest parcel hub.

It’s easy to buy 

The main barrier for buyers is finding what you want quickly. Vinted’s search function works surprisingly well. As sellers are forced to categorise at listing, buyers can find what they need far more quickly than other platforms.

Whilst you can ask a seller a question – for example clarifying size or condition – the user feels like they are buying from the platform rather than the seller. This is quite a contrast from social selling platforms which can involve an interminable back and forth with sellers who have not adequately described their items or marked them as sold. Mutual user ratings allow you to check on previous activity, reinforcing trust.

Buyers pay a “buyer protection fee” (a nice reframing of a service charge) which covers a refund if the item doesn’t arrive or is not as described. All of this reduces uncertainty, reinforces trust and minimises any lingering sense of loss aversion which could prevent a sale.

The bigger picture

What we’ve not mentioned is that buyers are getting some real bargains whilst reducing waste. The company estimate for every 2.56 pieces of clothing bought on Vinted, the purchase of one new piece of clothing was avoided.” After completing a purchase buyers are told “Thank you for shopping on Vinted, where beautiful clothes don’t cost the earth” – providing positive reinforcement.

This is feel good consumerism which normalises and encourages buying second-hand. 

In summary?

Friction determines our behaviour more than we realise. The clever ways Vinted has removed friction makes buying and selling easier, boosting its success.

Posted in Behavioral Science, Behavioural Science, Consumer Psychology, Customer Experience, customer journey, Market Research | Tagged , , | Leave a comment

Counterintuitive Shopper Habits

One of the joys of being a researcher is having your expectations confounded. You’re learning all the time.

We partnered with a client to explore how promotions influence online grocery shopping.

We were convinced that those who regularly bought treats like crisps, cake and chocolate (treat shoppers) would receive lots of promotions for them: adverts, money off and multibuy offers. It seemed a no brainer: those who bought something were surely more likely to be encouraged to buy more on future shopping trips.

The reality

Frequent treat shoppers were more likely to be targeted for promotions. They just didn’t see them.

This group were using workarounds to skip through the shopping process. Things like pressing “repeat last week’s order” – then deleting what they didn’t need from their basket. Or just adding items from their “favourites”. Their shopping trips were short. Targeted promotions often didn’t reach them.

Conversely it was new shoppers building baskets from scratch who were exposed to far more promotions. Their shopping trips were taking 4-5x longer. They had much more time to be shown promotions.

Inertia

Frequent online grocery shoppers just wanted to get their shop completed as quickly as possible.

One consequence was their baskets were very similar from week to week.

A lovely new study from a team at Cornell provides definitive proof on the topic. They explored 2 million shopping trips by US consumers using data from a representative shopper panel capturing both bricks and mortar and online shopping trips.

Analysis of the massive dataset revealed that when people shop for groceries online there is much less variety in their shopping baskets. What’s more, online baskets are more similar over time.

People buy from far more categories when they go to a real store.

Underlying needs

What this study confirms is that online grocery shopping amplifies inertia: people stick to buying the same things over and over. Most people are using the channel because it is easy, fast and convenient.

In store, you can’t help but be inspired by what you see, hear or smell. Whether it’s the purple-black hue of an aubergine, the marvellous marbling of the steaks or scent of fresh bread – this context is powerful. It influences what we buy more so than we realise or are willing to admit.

Closing the say-do gap

Observational research is the key to unlock complex research questions like this. You might have a strong hunch about what is going on – but if you skip to a solution you might miss the root cause.

The say-do gap means asking people to tell you what they normally do won’t cut it. People are often poor witnesses to their own behaviour, especially when it’s habitual.

Online you can let people get on with their habitual journeys, then get them to recap. In store you can let people browse and buy, then get them to talk you what they’ve just done.

And even if you a dataset with 2 million shopping you’ll still have outstanding questions. There’s no substitute for spending time with people to answer your list of ‘whys’.

Posted in Market Research | Leave a comment

The Say-Do Gap in Driver Behaviour

We recently finished a project about speeding and it was one of those projects where counter-intuitive findings came thick and fast.

Our goal was to examine ways to encourage drivers to keep to speed limits, so we needed to really get to the bottom of the behaviour. 

We recruited two groups and put dashcams in their cars for a week: 

  • Those who said they kept to speed limits
  • Those who admitted speeding from time to time 

The surprising thing? Everyone broke speed limits. In fact, some of those who claimed not to speed had more incidences of speeding than those who admitted it. 

Attitudes didn’t correlate with behaviour one bit. 

We also spent time driving with people on their regular journeys. Getting to work, picking kids up from school going to the shops. We thought the interviewer effect could mean people would be on their best driving behaviour with us present. Truth be told, after 5 minutes of driving people forgot we were there. 

This accompanied driving really helped our contextual understanding of where people drive too fast. 

Real-world driving is often automatic. Most of us will have experienced a time when we’ve been driving home – then suddenly realised we can’t remember driving for the past 5 minutes. You can drive the same route so frequently that you’re able to respond to it automatically. Here driving is a trade-off between reacting to unexpected occurrences (someone cut me up!) and habit (context-triggered actions when driving a known route).

This is why tactics like vehicle activated signage and road redesign make a real difference to speeding behaviours. In observations, we saw how they re-focus driver attention.  

We used the ISM model to structure our analysis. It breaks down behaviour into three component parts: 

  • Individual factors relate to the person: their values, attitudes, skills, and evaluations 
  • Social factors relate to the presence of other people on the road
  • Material factors relate to aspects of the environment and infrastructure which affect how the driver interacts with the road 

Whilst we uncovered lots relating to the individual and their personal circumstances, many of the surprising and counter-intuitive findings related to material factors. Reviewing driving footage showed us how much people reduced their speeds on narrower roads for example. 

Our analysis of the cues in the built and social environment – combined with individual beliefs and habits – formed the basis of a new strategy to encourage behaviour change, which we developed in interviews and group workshops.

This project has been a reminder of some of the principles we abide by:

  • We define the behaviour carefully 
  • We observe, as well as ask 
  • We triangulate our methods to get the complete picture 

The last one is particularly important. Attitudes are a poor predictor of driving behaviour. When it comes to a complex issue like speeding, researching attitudes alone is not enough.

Posted in Market Research | Leave a comment

What does generative AI mean for qualitative research?

The first AQR hackathon took place today. 60 colleagues from across the industry came together to participate, learn, and reflect together on what generative AI means for our professional community.

I split the event in two parts: listening then doing.

We started with three expert speakers who educated us in contrasting domains.

  • Mike Stevens (Insight Platforms) laid out 10 use cases for these tools across the research cycle in his talk. This was a zippy masterclass covering a dizzying amount of practical application. Whilst some of the applications were scary for the audience (robot moderators arrgghh!) the clear need for a human to be in the loop provided some reassurance.
  • Alasdair Ramage (Arca Blanca) took us on a guided tour of how organisations have commercialised AI. Two takeouts: a) Experiment & play. Productivity enhancements and time savings will soon emerge. b) Any business which has processes which go through cycles quickly are at an advantage as they can learn and iterate better.
  • Dr Chandrima Ganguly, an expert on the ethics of AI (Lloyds Banking Group) rounded things off with their view on how to Using generative AI responsibly. Chandrima lifted the lid on how LLMs work: how they are trained and built; what their inbuilt biases are; and the practical steps we can take to de-bias the outputs. Practical tips around providing relevant social and cultural context, previous data, and the specifics of the outputs we need.  

Themes

The panel Q&A was redundant as the audience asked copious questions as we went. Whilst the themes are challenging to summarise, some important reflections included:

  • The distinction between models (LLMs like GPT-4 – which took $64m to train) and applications built on top of them (e.g. Yabble or Jasper);
  • The acknowledgement that GPT-4 is inherently biased. It was trained on large amount of Reddit data: English language, culturally American, and a social media with a peculiar user base.
  • The recognition that we need a human in the loop. Applications built on LLMs should be checked, weighted/adapted; our prompts should be carefully constructed and the outputs should be checked and checked again.

The hackathon

We then split into teams and complete tasks against the clock. 10 teams explored writing and imagery generation tasks using free to use tools.

What was particularly useful was the collaborative feedback from the teams afterwards.

  • Writing using ChatGPT removes the blank page allowing you to make faster progress. Yet many felt its outputs could be generic and superficial, overly rational and requiring considerable skill and iteration to get right. One task related to NPD in the household cleaning category. It threw up a valuable example: typically this is undertaken by men in China – contrary to Western norms. This was a potentially misleading blindspot for Chat CGPT’s outputs.
  • The outputs from free imagery tools were poorly received: unimaginative and clichéd. Paid versions fared better. 

We then looked at three qual specific platforms. Each has the potential to provide significant time savings across the project cycle.

  • Online community moderation and video clipping using Qualzy. The instant translation of moderator prompts into other languages, and the fast analysis of participant video was the highlight. Ready-made prompt suggestions for moderators were also invaluable.
  • Summarisation using Quillit. Users thought this could save a significant amount of time creating a first draft of a report using transcripts. Getting to an answer faster.
  • Thematic analysis and reporting using CoLoop. Users described this as a “very effective research admin assistant.” Several imagined a world where your groups from last night were available in the morning in a readymade analysis grid – leaving you to do the clever thinking.

Bringing the strands together

Ultimately, qual is all about nuance. Seeking nuance, seizing on nuance and reporting on nuance. Generative AI tools do the opposite: they flatten the jagged edges of human experience to a flat plane. Terabytes of computing power do not and will not remove the need for expert human judgement.

The verdict? High quality research cannot be automated.

With thanks to our speakers Mike, Alasdair and Chandrima; our platform partners – Jack from CoLoop; Maria from Civicom; Paul Eric and Ray from Qualzy; our AQR hosts Lucy and Ella; and our venue sponsor Truth Consulting.  


Posted in Market Research | Tagged , , , , | Leave a comment

Battling Overchoice

Imagine a parallel universe where the more competition there is, the better dominant players perform. Where the more competitors there are, the longer incumbents stay on top. 

This is exactly what a new research paper concludes: increased competition entrenches the advantages of dominant firms. Johan Chua, Assistant Professor of Organisations and Strategy at the Chicago Booth School of Business conducted a series of simulations to show that – counter to what economic theory assumes – new players entering a market make life easier for dominants. 

Why? Faced with too much choice people “default to largest most well-known providers.” 

Whilst the paper relies on mathematical modelling, at its heart this is a story about psychology, not economics – our brains rather than our wallets.  

Abundant information imposes a cognitive burden 

Too much choice weighs us down: we end up taking mental shortcuts because thinking and deciding takes up a huge amount of energy. 

Relying on known brands ends up being a pretty good solution if there’s loads of choice – you’re pretty much guaranteed a minimum level of quality.

Abundant information means cognitive biases are amplified  

When we are overloaded with information it hampers our decision making and magnifies our cognitive biases. 

For example we might focus on items that are more prominently displayed and be swayed by information which confirms our preconceptions. It might not feel like it at the time but we’re pushed into coping strategies which limit our decisions. 

This applies to domains like entertainment too. 

As options multiply, choosing gets harder. You can’t possibly evaluate everything, so you start relying on cues like “this movie has Tom Hanks in it” or “I liked Red Dead Redemption, so I’ll probably like Red Dead Redemption II,” which makes you less and less likely to pick something unfamiliar.”

I for one spend more time on the Netflix menu than watching Netflix. When “…six of the top seven films in 2021 were part of the Marvel Cinematic Universe, and the top nine films were in franchises” I know I’m not the only one finding it hard to choose a movie.

Some are jaded before they’ve even started

As one consumer put it to me recently: “Just the thought of searching for car insurance makes me feel exhausted.” 

Let’s face it, the internet brings unwanted complexity to categories that don’t need it. Who benefits from getting 429 results when you search for a tin opener on Amazon? Probably not the buyer. 

Our observational research shows buyers quickly develop shortcuts. Whilst this varies by category – a strategy of opting for the cheapest, a known brand or requiring a minimum number of reviews helps cut down the complexity. 

Information overload means we need curation more than ever

If information overload is the problem then curation – relying on the judgement and taste of the informed to cut through complexity – is one answer. People are willing to pay for guidance, honed through experience, on what’s important and what’s not. Daniel Levitin, author of the Organised Mind puts it succinctly: 

“Successful people— or people who can afford it— employ layers of people whose job it is to narrow the attentional filter. That is, corporate heads, political leaders, spoiled movie stars, and others whose time and attention are especially valuable have a staff of people around them who are effectively extensions of their own brains, replicating and refining the functions of the prefrontal cortex’s attentional filter.

For us mere mortals, this is more likely to mean a substack subscription from an informed insider, a pared down Twitter feed or just some trusted peers to help us along the way. 

Who knows, maybe generative AI will develop into a digital concierge to smooth our paths. One thing’s for sure. The information age has created tension between accessibility and illumination, and we could all do with a little help.

Posted in Behavioral Science, Behavioural Science, Choice | Leave a comment

MRS Awards: my tips as a judge

We’re in high summer and applications for the MRS Awards are open.

I often get asked for tips on how to approach writing a paper, so I decided to gather these in an article for the MRS.

There are so many reasons to put pen to paper. 

The pace of our industry doesn’t always encourage reflection. Taking time to think about our process and craft, questioning how and why we approach our work the way we do, pushes you out of your comfort zone. That’s the simplest reason for writing a paper: it makes you a better researcher.

The MRS Awards are also an opportunity to contribute to the evidence base of our profession. As an industry, the landmarks by which we get our bearings are changing. Bringing your best work to a public forum serves a greater good: we all benefit from sharing in evidence-based expertise.   

Here’s some practical tips on pulling together an entry.

Choosing an idea

  • Have a think about your recent projects. What was new, different or had clear impact?
  • Check the criteria for each category. How does your case study meet it? Are there any gaps?
  • Be hard on yourself. Results make or break it. What changed? What evidence do you have?
  • If you’re stuck – take a look at papers from previous winners for inspiration. What do they do well? How do they structure their arguments? How long are their sentences? What themes can you discern? This is your shortcut to success.

Writing

  • Give yourself time. The deadline isn’t until July 6th so you’ve got a whole 2 months. You may need client quotes, sales data, pack shots etc. Get the ball rolling.
  • Show don’t tell. Winning entries provide evidence of results, excellence in methodology and execution and relevant and successful innovation. Don’t just tell the judges that the project had a huge impact; show
  • We all approach writing differently. My advice? Good writing is good editing. Get a first draft down, then edit, edit, edit. Show someone you trust and ask them to cover it in red pen – and then edit some more.
  • Is your entry too long? You won’t be the only one so don’t worry. Simplify without losing the essence of your story. Can you reason by analogy for brevity? Can a diagram or model help? It’s impossible to include every detail. Deciding what to leave out will be as important as what you put in.
  • Aim to finish a week ahead of deadline then leave it alone. Pick it up with fresh eyes a few days later to do a final check.

Content  

  • Don’t be afraid to convey what was at stake, and how your research addressed it. Tell us about how the different players collaborated and how that contributed to the outcomes.
  • Do a final check for jargon: don’t assume every reader will be familiar with every arcane acronym.
  • Break up your text: judicious use of subheadings to signpost the argument you are making and bold text and italics to emphasise key points really help the judges.

Posted in Awards, Market Research, Market Research Society | Leave a comment